The Summer Slowdown
If this year is like last year, we have now begun a few months with low levels of the covid-19 virus circulating in our communities. The data come from sampling sewage, and I’ve translated that into how many people are contagious with covid-19 out of every 100 people. I’ll show you the math below.
If 1 of every 100 people (or fewer) is currently contagious with covid-19, I’m going to call that a “low” level in the community. For the Northeast region (one of Biobot’s four regions), we got into the low range on March 30th. The rest of the country is even lower.
Last year, as a national average, we were at this low level from March 11th to August 5th, as shown below in the graphs from Biobot.
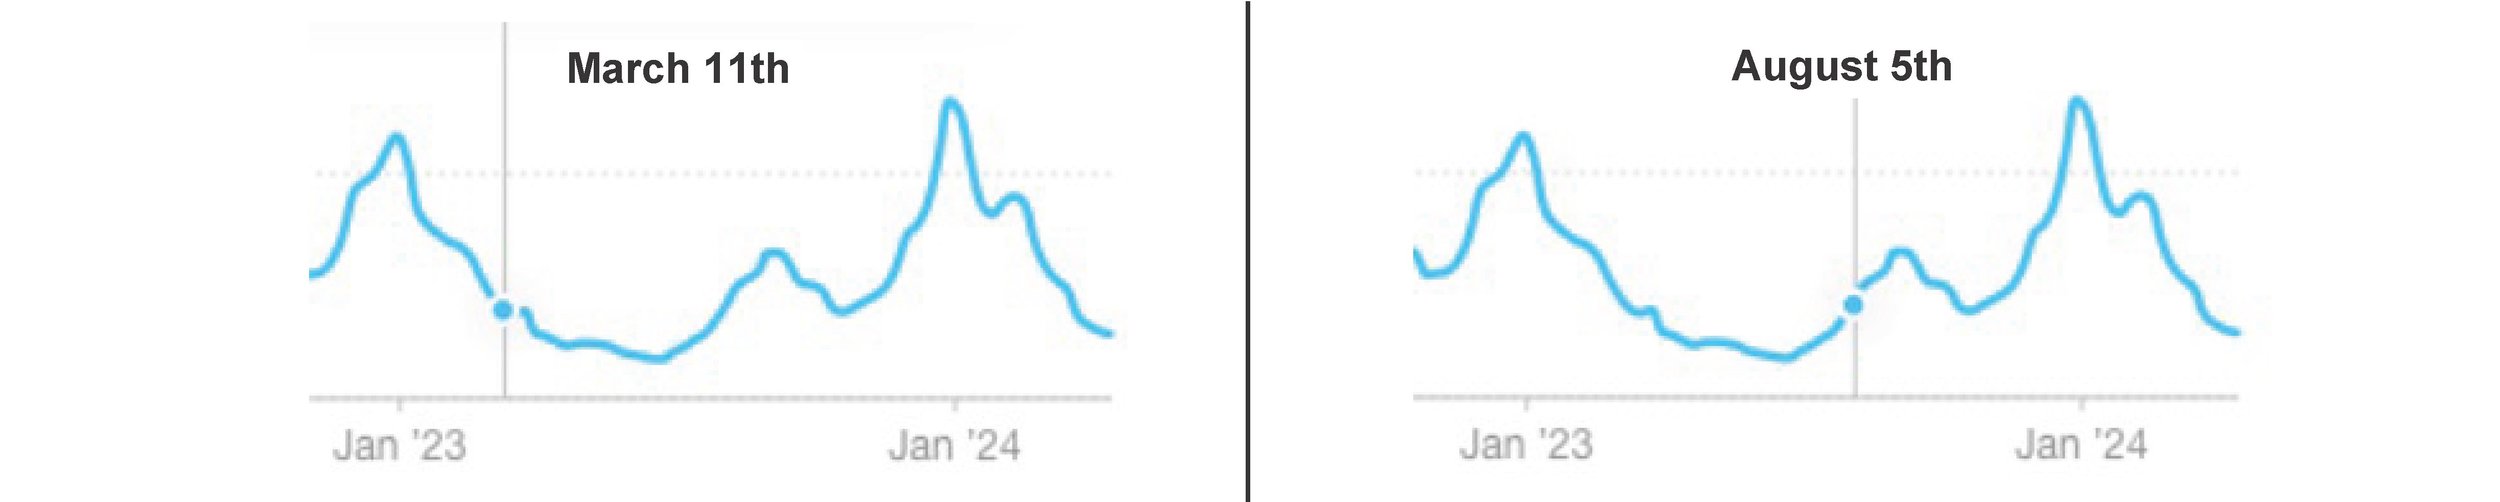
After that, the levels went back up as people closed up buildings to run air conditioning, and then went back to school. I expect the same thing will happen this year.
And for now, it’s encouraging that we have low levels and can gather safely in the ways in which I’ve described in earlier blogs.
Here Is the Math Summary
Several covid-19 modelers made translations from sewage sampling to case rates. I’m using the work of modeler JP Weiland, who had national new cases about 1,100 times the average copies/mL. I calculated this from the three points shown with arrows in the chart below, and correlated them with the Biobot data.
9/22/23, Biobot—640 copies, Weiland—718,367 new infections. (x 1122)
6/17/23, Biobot—168 copies, Weiland—185,204 new infections. (x 1102)
12/13/22, Biobot—1,160 copies, Weiland—1,302,041 new infections. (x 1122)

These are new infections, and we need to multiply these by the average number of days a person is contagious. There’s no easy answer, but I’m using 7 days, based in part on the chart below.

Now we can find the sewage sampling rate that leads to the figure of 1 in 100 people being contagious. It turns out to be 432 copies.
432 x 1100 = about 475,000 new infections
divided by 333 million people in the U.S. =
about 1 in every 700 people infected today and
divided by 7 days = 1 in 100 contagious today.
Note that individual sampling sites will vary and cannot be directly compared. That is, the absolute numbers may be different, so the 1100 factor will not apply, but overall shapes of the curves will probably be similar, with perhaps even lower points to come in the next few months by a factor of two three.
Now You Can Search This Blog!
We have added a “search” bar for this blog - scroll all the way down
to the very bottom of a blog page to find the search bar.
When using the “search” bar, please, if at first you don’t succeed, try, try again!
[The website company has an ongoing glitch.]
Find all of the blog post titles on our “Resources” page on the website:
Comprehensive List of Blog Postings (PDF).