Of course, there is no one right answer. I’ll have a future blog post on “endemic” and what it means. For now, I was thinking of last summer, pre-Delta, when the case count in New Hampshire was as low as 20 a day. I was tentatively venturing out then, even risking a vacation to the beach. Now those look like the good old days.
As I hope you know by now, comparing case counts pre- and post-Omicron is not valid because the number of Omicron cases is way higher, per hospitalized person for example, than pre-Omicron. So I looked up the valid comparison measures of hospitalizations and deaths. See Covidactnow.org charts below:

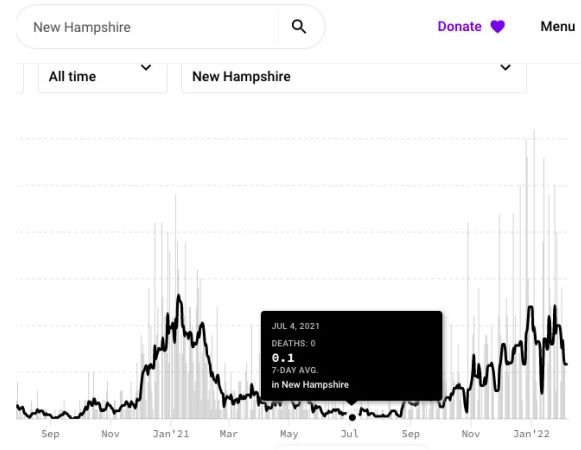
Of these, to me, hospitalization is the best metric. (People stay multiple days in the hospital, so the 20/day count of hospital patients, compared to the 20/day cases, does NOT mean that 100% of cases end up in the hospital.) I’ll be looking for hospitalization rates down in the 20’s. That will be about 10% of the current numbers, so we have a ways to go.
The other excellent metric to follow comes from the well-known Georgia Tech site (covid19risk.biosci.gatech.edu), where they predict the probability of encountering one or more people currently with covid-19, based on the community spread numbers. So if I go into a small grocery store, let’s say assuming 100 people in the building, and the odds are less than 10% that there are one or more covid-positive people there, I would feel pretty good about that.
I don’t feel good at all about the current risk, which says that there is definitely some covid-19 virus in the air of that grocery store—see the graphic below. But we are moving in the right direction, as shown by the graphs above!

We’d like to hear your thoughts - we welcome those thoughts by email at safetulator@kohlerandlewis.com.